
Does Trap Position Really Matter?
Some punters ignore the trap draw. The statistics suggest that’s a mistake. In a sport where races are decided by fractions of a length and the first bend is reached within four seconds of the traps opening, starting position has a measurable impact on outcomes. Not an overwhelming one — the best dog in the race can still win from any trap — but a consistent, statistically significant one that tilts the field in predictable directions.
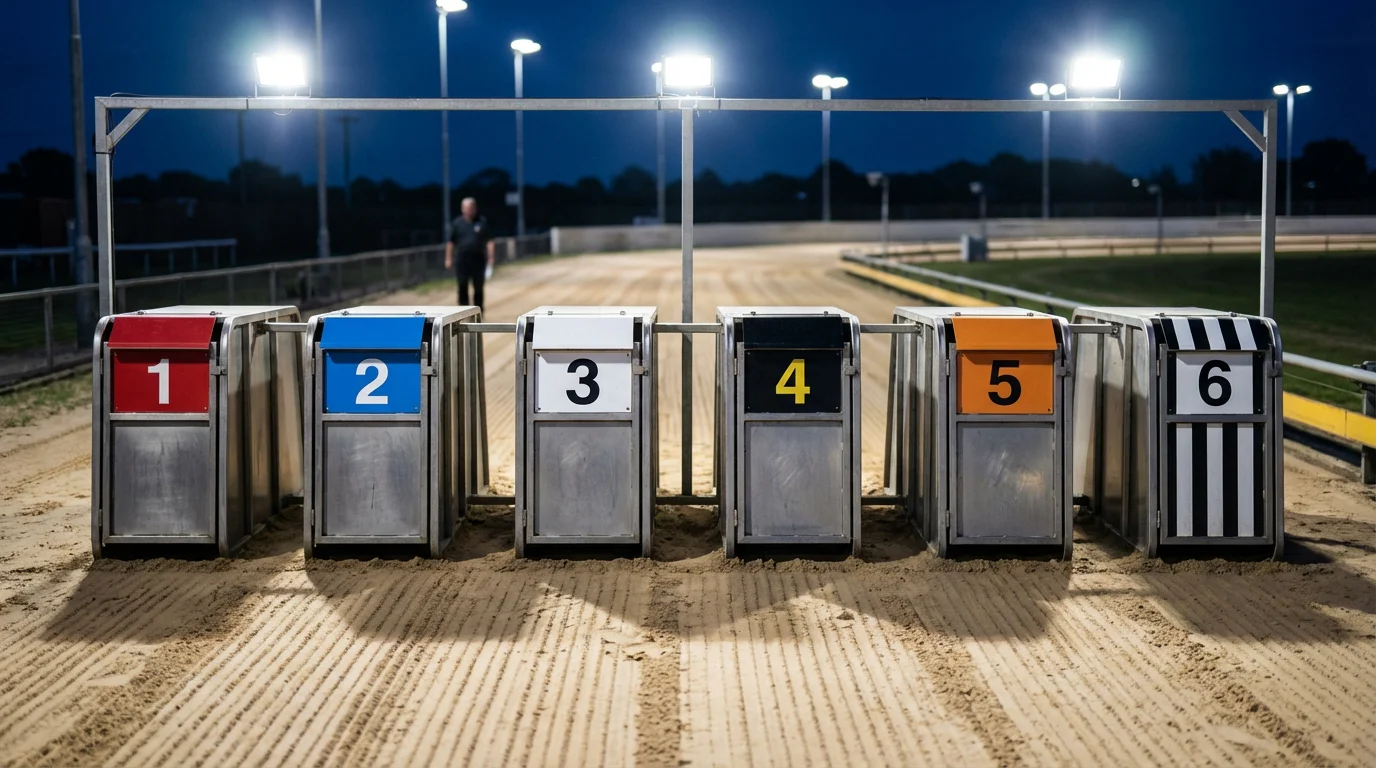
The trap draw assigns each dog to one of six starting positions, numbered left to right from the inside rail. Trap 1 is closest to the rail on the first bend. Trap 6 is widest. In between, each position carries different advantages and disadvantages depending on the track layout, the distance of the race, and the running styles of the dogs drawn alongside. None of this is hidden. Trap statistics are published by racing data providers, track-by-track, and any punter with a browser can access them. Yet most casual bettors treat the trap draw as background noise — something they notice on the race card but don’t factor into their selections.
That’s an edge left on the table. Not because trap statistics alone can make you profitable, but because they represent a free variable that interacts with everything else you already know about a race — form, pace, fitness, and trainer intent.
UK Trap Win Percentages by Position
Across UK tracks, Trap 1 and Trap 6 tell very different stories. National aggregates show that Trap 1 wins the highest percentage of races overall, typically around 18-19% of all starts, against an expected 16.7% if traps were neutral. Trap 6 sits at the other end, winning closer to 14-15% at most venues. The middle traps — 2 through 5 — cluster around the expected average, with Trap 2 usually performing slightly above par and Traps 4 and 5 slightly below.
These percentages look small in isolation, but they compound over volume. A punter who systematically ignores trap position is giving up approximately two percentage points of edge on inside draws and absorbing a similar deficit on outside draws, before any other factor is considered. Over hundreds of bets, that gap becomes significant.
The reason Trap 1 outperforms is straightforward: the rail. A dog breaking from Trap 1 has the shortest route to the first bend and can hold the inside line without needing to cross in front of other runners. If it breaks level or ahead of the dog in Trap 2, it has a clear run into the bend with no congestion. Dogs drawn wider must either show exceptional early pace to cross in and secure a position, or accept being pushed wide through the turn, which adds distance and costs time.
Trap 6 has compensating advantages at specific tracks where the run to the first bend is long enough for a wide runner to build speed and sweep around the field. At tracks with a long home straight or wide first bends, the outside trap can suit a dog with sustained early pace. But these conditions are track-specific, not universal. At tighter circuits — Romford, Crayford, Hove — Trap 6 is a measurable disadvantage for all but the fastest breakers.
The aggregate statistics also mask significant track-to-track variation. A trap that over-performs at Nottingham might be neutral at Sunderland and negative at Monmore. Relying on national averages is better than ignoring trap data entirely, but the real value comes from studying track-specific breakdowns.
Trap Bias at Towcester — Derby-Specific Data
Towcester’s first bend punishes inside runners who break slowly. That’s the defining characteristic of the Derby venue’s trap bias, and it matters more here than at almost any other UK track because every Derby heat, semi-final, and final is run over the same 500-metre course.
The run from the traps to the first bend at Towcester is relatively generous — longer than at many UK circuits — which gives dogs in the middle and outside traps time to establish position before the field compresses into the turn. This partially neutralises Trap 1’s usual rail advantage, because a Trap 1 dog that doesn’t break sharply can be crowded at the bend by dogs from Traps 2 and 3 who have used the run-up to build momentum.
Historical data from Towcester’s race results shows that Trap 1 still wins more than its fair share over 500 metres, but the margin over Traps 2 and 3 is narrower than the national average. Traps 3 and 4 perform relatively well at this venue, likely because the bend geometry allows middle-drawn dogs to slot in behind the pace without being pushed excessively wide. Trap 5 is neutral to slightly negative. Trap 6 underperforms, though not as dramatically as at tighter tracks.
The third and fourth bends at Towcester introduce a separate dynamic. Dogs that race wide through the early part of the contest can lose additional ground on these later turns, compounding the distance deficit they accumulated at the first bend. This means that a wide draw at Towcester doesn’t just cost a dog at the start — it taxes them throughout the race. For Derby betting purposes, this makes Towcester course form from wide draws particularly informative. A dog that ran well from Trap 5 or 6 at Towcester has demonstrated the ability to handle the track’s geometry under adverse conditions, which is a stronger signal than a similar performance from an inside draw.
Matching Running Style to Trap Draw
A railer drawn wide has a problem. An outside runner drawn in Trap 1 has a bigger one. Running style and trap draw interact in ways that simple trap statistics don’t capture, and this interaction is where the most actionable betting edge lives.
Railers — dogs whose natural racing line is tight to the inside rail — perform best from Traps 1 and 2, where they can establish their preferred position without needing to cross the field. A railer drawn in Trap 4 or wider faces a decision at the first bend: cut across other dogs to reach the rail, risking interference and lost momentum, or race in an unfamiliar wider position. Neither option is ideal. Form guides often note a dog’s preferred running line with abbreviations like “Rls” for rails or “Mid” for middle runner, and cross-referencing this with the trap draw is one of the simplest and most effective adjustments you can make to your assessment.
Wide runners — dogs that naturally race away from the rail, using the outside of the track to build and maintain speed — are less disadvantaged by outside draws but significantly compromised by inside ones. A wide runner from Trap 1 has to navigate around the entire field to reach its preferred position, which means it either gets stuck on the rail behind slower dogs or burns energy and time fighting its way out. These dogs often show their worst form from inside draws, even if their raw ability is superior to the rest of the field.
Middle runners are the most adaptable, but they’re also the most affected by the dogs drawn either side of them. A middle runner from Trap 3 flanked by two fast breakers might get squeezed at the first bend. The same dog from Trap 3 with slower breakers alongside might have a clear path to the front. Reading the full trap draw — not just your dog’s position but the running styles of its neighbours — is essential for forecast and tricast bets, where the finishing order depends on exactly these kinds of interactions.
How to Factor Trap Position Into Your Bets
Trap draw isn’t everything, but ignoring it means ignoring a free variable. The practical application starts with a simple question before every bet: does this dog’s trap draw help or hinder its natural racing style? If the answer is “hinder,” you need the dog to be significantly superior to the field to overcome the positional disadvantage. If the answer is “help,” a dog that looks marginal on form might be better than its odds suggest.
For Derby betting specifically, the round-by-round trap draw provides opportunities that don’t exist in regular racing. A dog that won its Round 1 heat from Trap 2 but is drawn in Trap 6 for Round 2 might see its odds drift from 2/1 to 4/1 purely on the basis of the draw. If you believe the dog has the early pace to overcome the wider berth — based on its sectional times and previous performances from outside boxes — that price drift represents value created by the market’s overreaction to trap position.
The reverse is equally useful. A dog whose odds shorten dramatically after drawing Trap 1 might be absorbing more market enthusiasm than its actual advantage warrants, particularly if it’s not a natural railer. Inside draws help, but they don’t transform average dogs into winners. If the market treats a Trap 1 draw as a two-tick upgrade, and your form analysis says the dog is still the third-best runner in the heat, the short price is one to avoid rather than follow.
The Bend Decides — Position Yourself Accordingly
The best greyhounds overcome bad draws. The rest lose from them. That’s the reality of trap position in a sport where the first bend is reached in seconds and a length lost at the turn can mean three lengths lost at the finish. The data backs this up consistently, track after track, year after year.
Trap statistics are not a system. They won’t tell you who wins. But they will tell you which dogs are facing an uphill fight and which have the geometry in their favour. Combined with form, pace, and running-style analysis, trap data turns a six-variable race into something closer to a four-variable race, where two runners are either helped or hindered in ways you can quantify before the traps open. That’s not a guarantee. It’s a head start.